Mehrdad’s Bed
Typically, bubbling fluidized beds are produced by uniformily–in space and time–driving a gas flow through a particle bed. Slightly different bubbling patterns are observed depending largely on the Geldart classification [G73] of the particles and the size of the bed. Like gas bubbles in a liquid bed, the dynamics are almost always highly irregular and chaotic in nature. However, by periodically driving the gas flow, chaotic bubbling can be suppressed yielding quasi-regular periodic bubbling [PB98]. Studying bubble control methods, Coppens and coworkers [Cv03] realized that periodic bubbling produces starkly regular patterns in thin beds, which may be useful for code validation [WdLC16]. Shahnam and coworkers took the problem even further and reducing the latteral dimension to produce an oscillating Left-Right single bubble pattern in a setup affectionately referred to as Mehrdad’s bed [S18].
Mehrdad’s bed is a rectangular geometry of width \(L_x\) = 50 mm, height \(L_y\) = 160 mm, and depth \(L_z\) = 5 mm. The domain is resolved by a uniform CFD grid of \(80 \times 256 \times 8\). No-slip walls are applied on the vertical domain extents with a mass inflow at the bottom and a pressure outflow at the top of the domain. The mass inflow is defined in usr1.f90 as:
real(rt),   intent(in ) :: time
real(rt) :: usr_pi, usr_umf

usr_pi  = 4.0d0*ATAN(1.0d0)
usr_umf = MIN(0.15d0, 0.1d0*time)

bc_u_g(1) = usr_umf*(1.3d0 + 0.7d0*DSIN(10.0d0*usr_pi*time))
The bed consists of 188500 particles which are assumed to be monodisperse with constant diameter and density of \(d_p = 400\) microns and \(\rho_p = 2500\) kg/m3 , respectively.
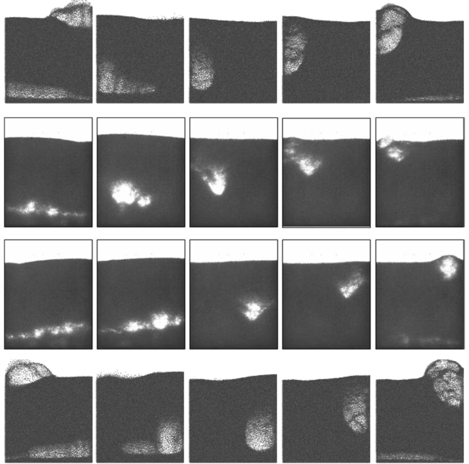
Fig. 8 Comparison of the experiment (middle two rows) to the MFIX-Exa simulation (top and bottom rows).
The bed is simulated using MFIX-Exa 19.08 for an initial transient period of 10 s before an observation window of an additional 5 s. The desired left-right pattern is seen as shown in the figure above.